The scale of animal suffering

How many animals do we kill?

Millions of animals lose their lives every day for our food. The numbers are so vast that they are almost impossible to grasp. Behind every one of those figures is an individual: an animal with its own personality, capable of feeling pain and emotions, and with a desire to live. The good news is that eating plant-based is delicious, healthy and more accessible than ever.

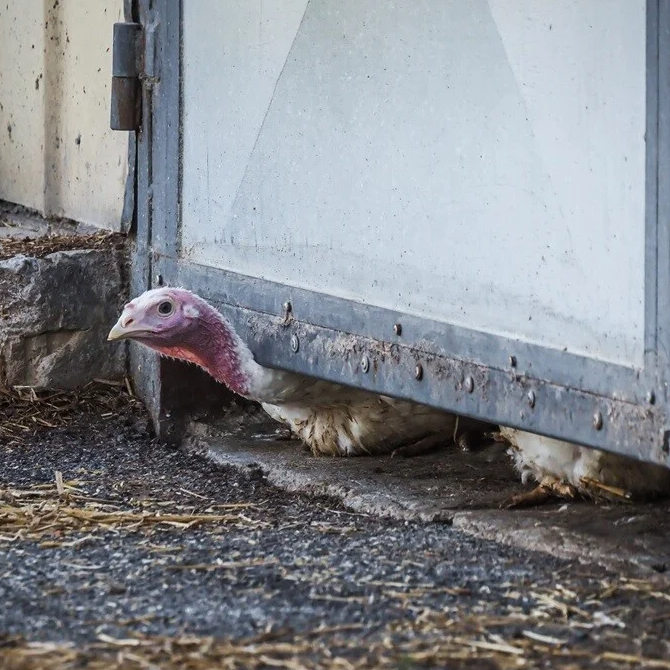
Turkeys

The global figures.

Land animals per year
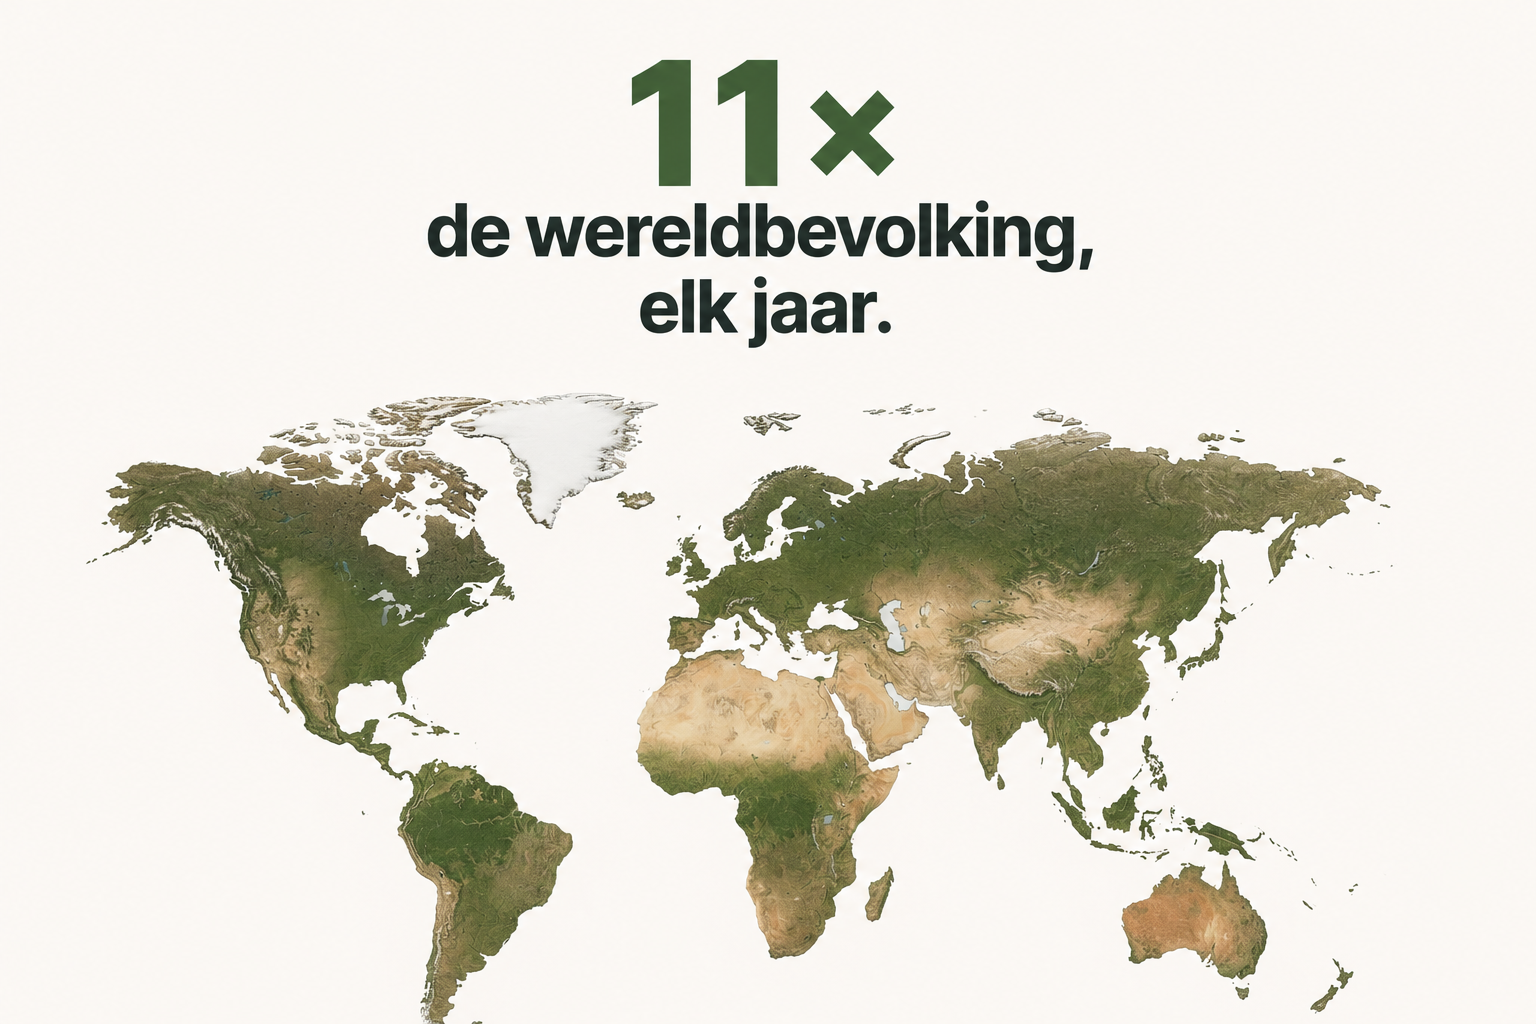
88 billion

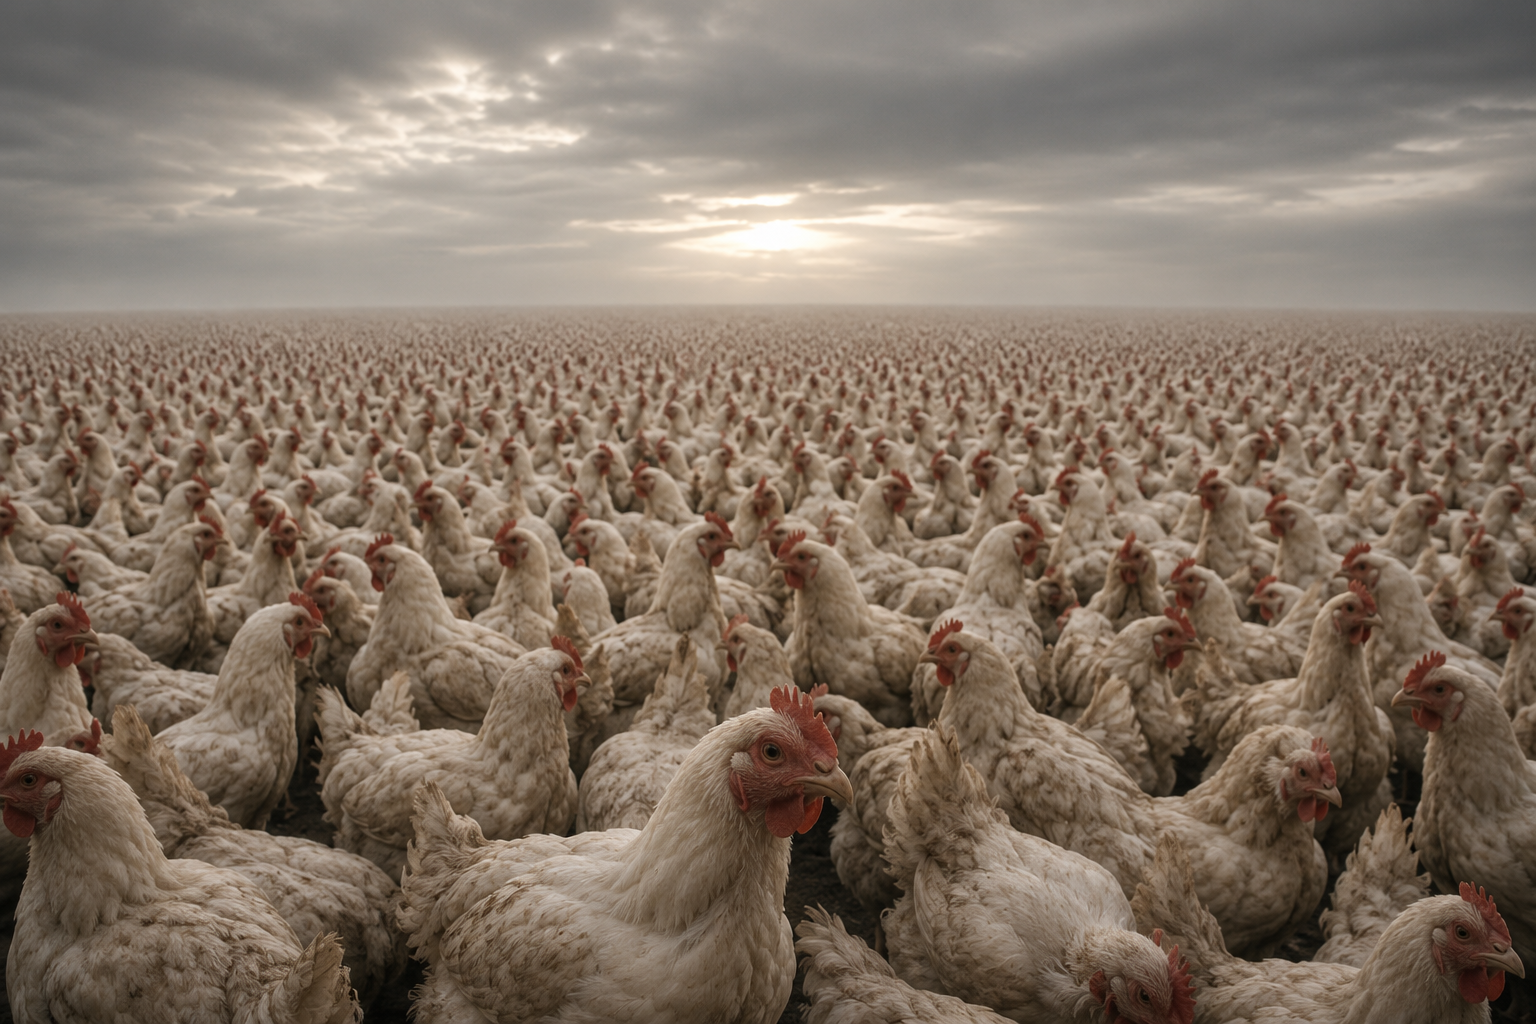
Most of them are chickens. They are small, inexpensive to raise, and bred and killed in enormous numbers. If we continue as we are, this number will keep rising.

0 land animals since you arrived here
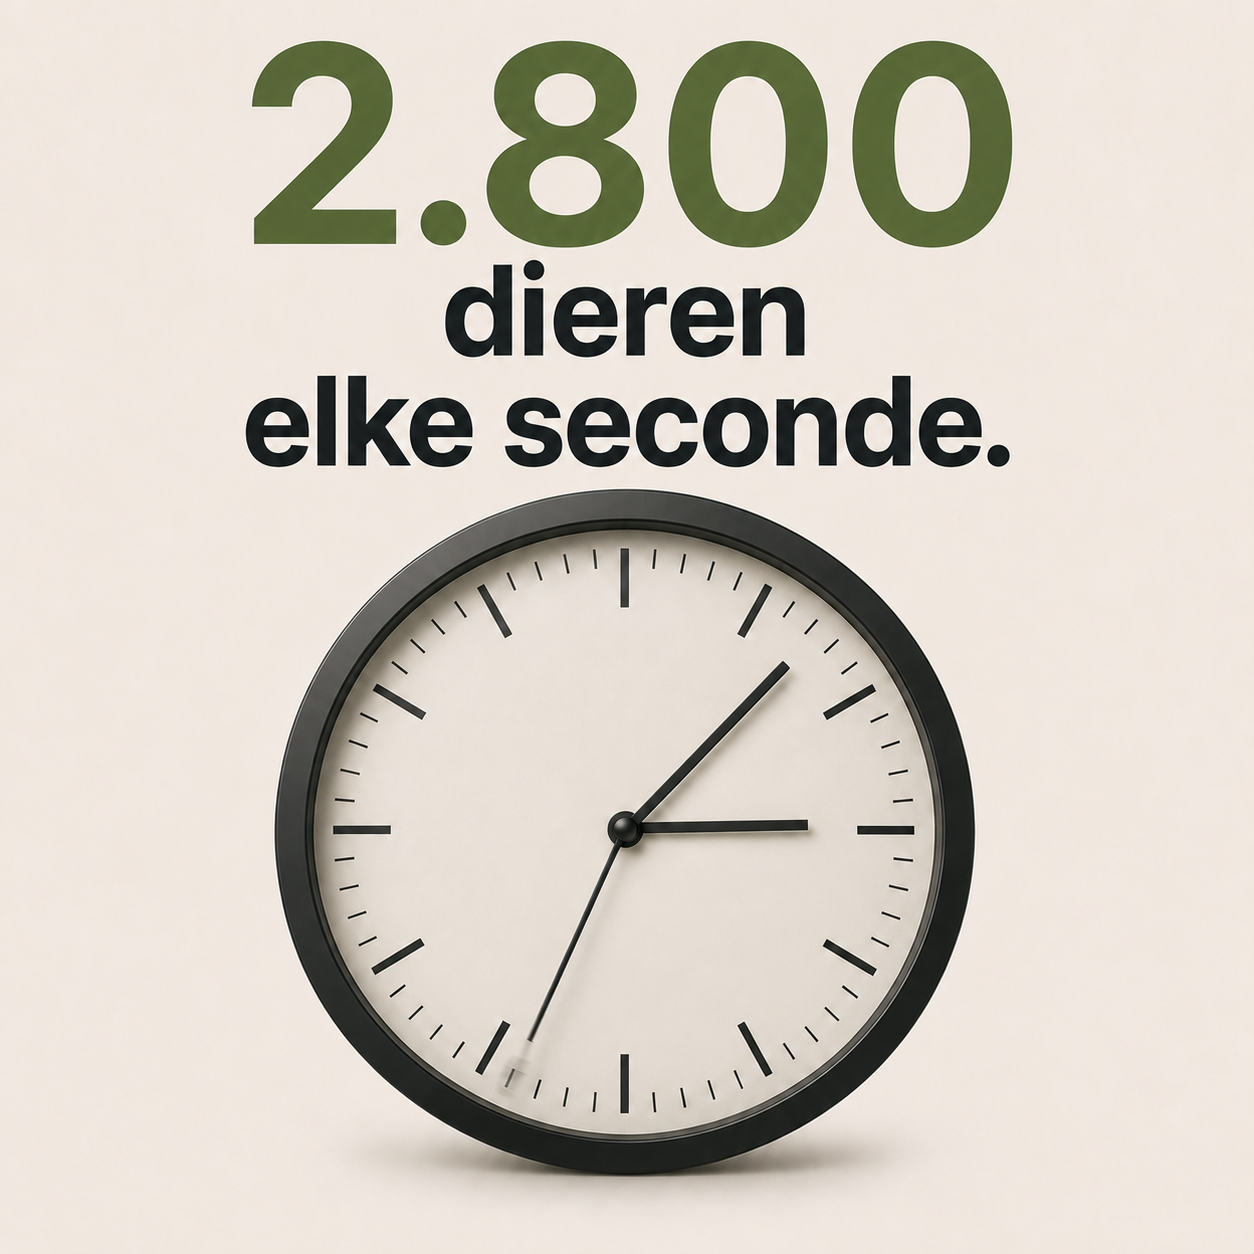
10,000 every 3 seconds
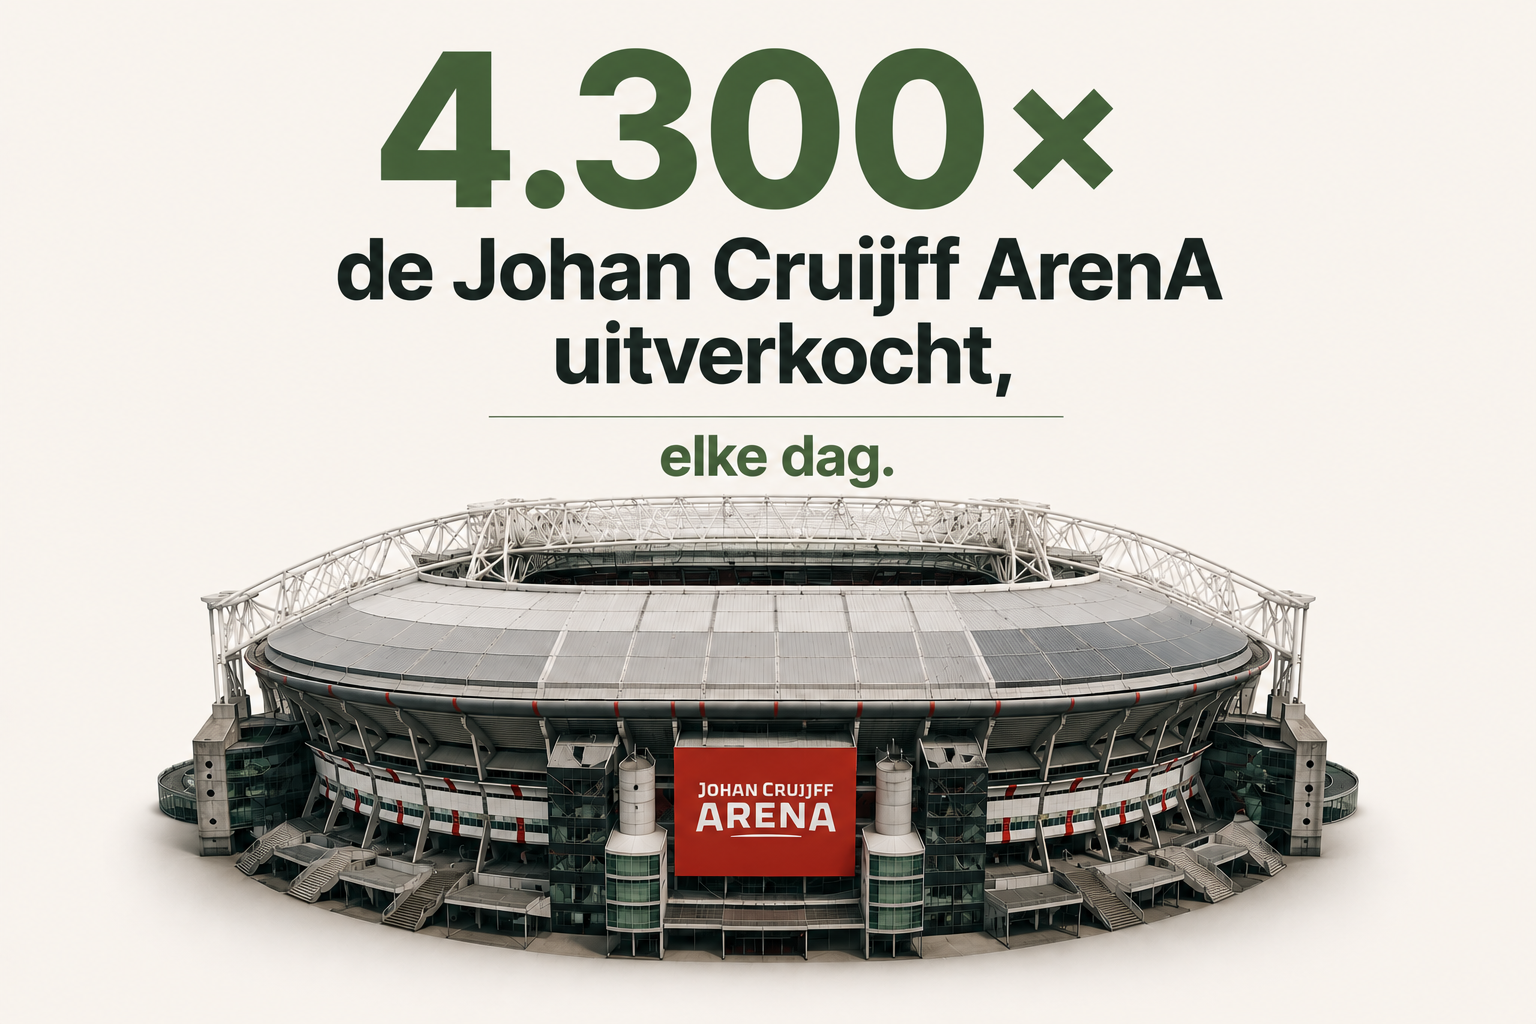
241 million per day

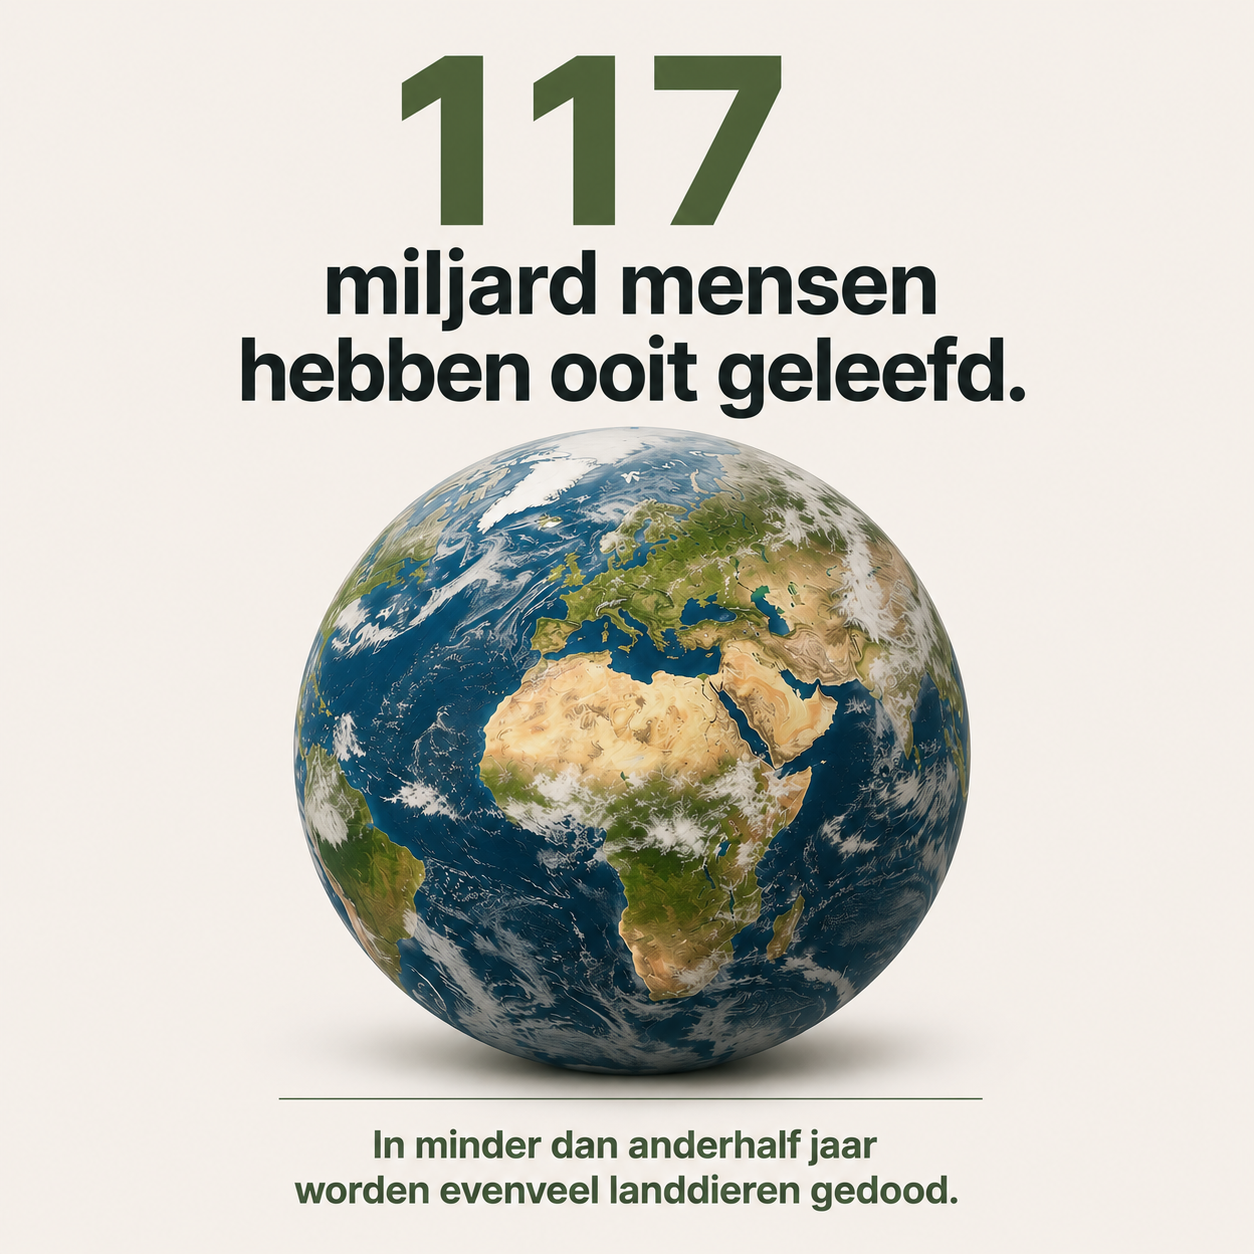
More than all humans who have ever lived

An estimated 117 billion humans have ever lived. We kill nearly that many land animals in less than a year and a half.

And fish are not even included

For fish, the number is likely in the hundreds of billions to even trillions each year. Their lives are often measured only in kilograms, not as individual animals.

Visualization of the global number of land animals killed

Which animals are killed in the greatest numbers each year?

Below you can see how many animals of each species are killed worldwide each year.

305,000,000
Cattle
564,000,000
Goats
704,000,000
Sheep
1,494,000,000
Pigs
4,228,000,000
Ducks
78,534,000,000
Chickens

Visual scale adjusted so smaller figures remain visible.

And how many animals do we kill each year in the Netherlands?

Below you can see how many animals of each species are killed in the Netherlands each year.

205,000
Goats
515,000
Sheep
1,910,000
Cattle
14,100,000
Pigs
21,875,000
Chickens
496,500,000
Broiler chickens

Visual scale adjusted so smaller figures remain visible.

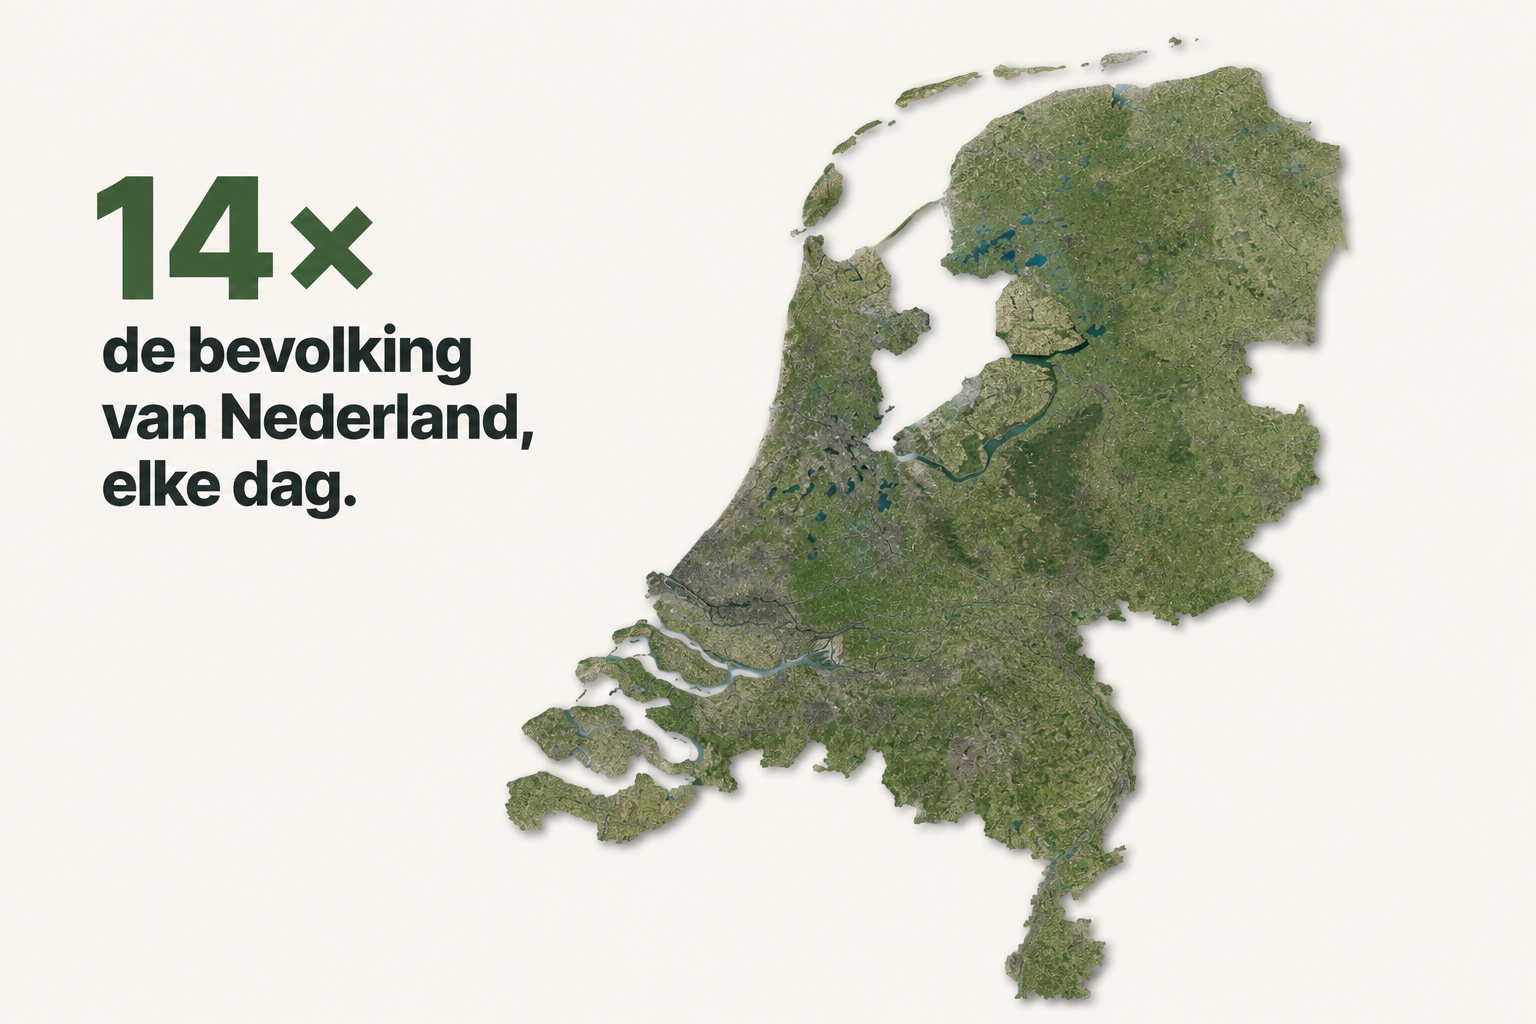
In perspective.

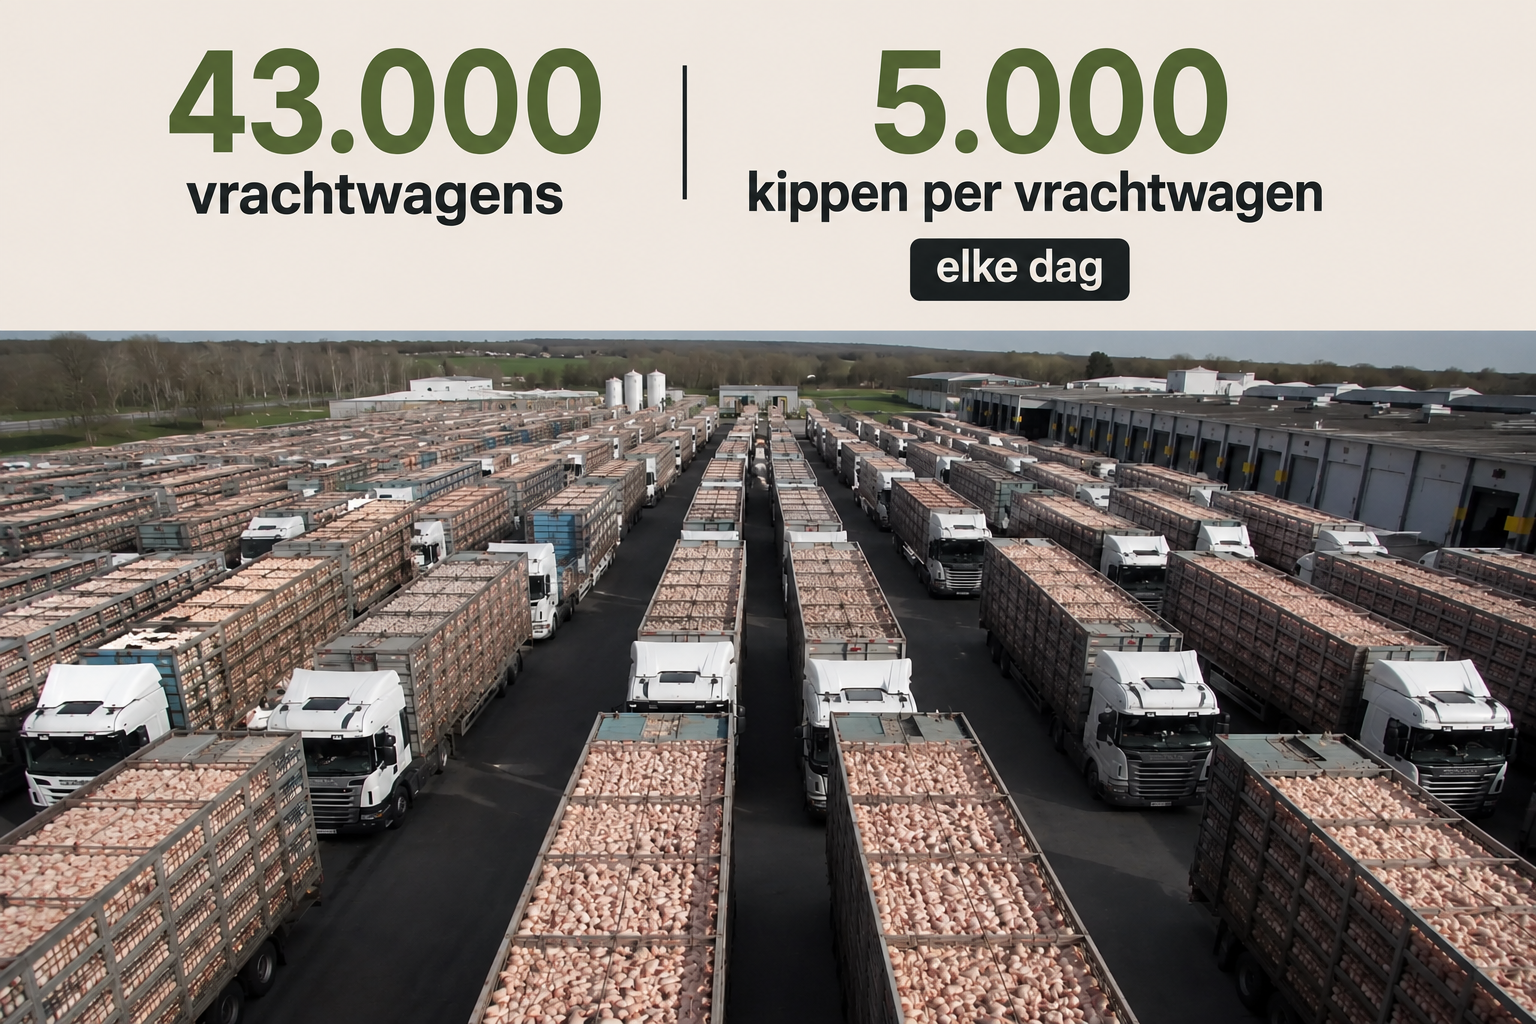
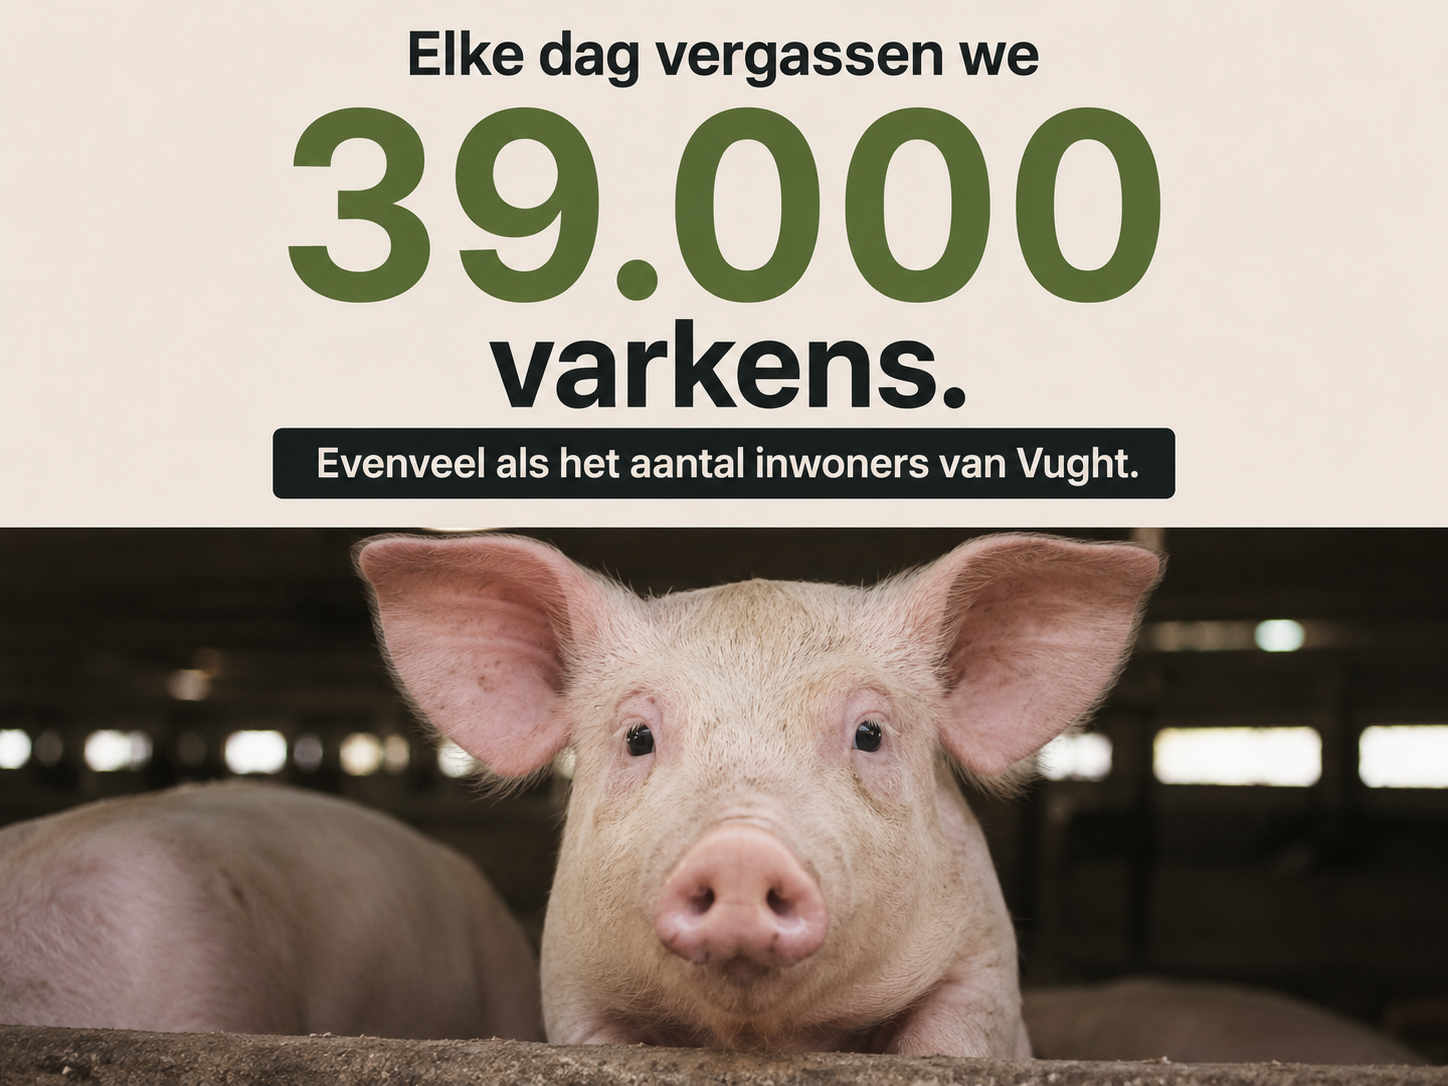
Large numbers often feel abstract. These images place the figures side by side. Note: this concerns land animals only.

Start with one choice that reduces animal suffering

You do not have to change the whole world in a day. Start with your next meal. For you, it is a choice. For an animal, it can mean everything.

Get started
Sources and notes on the figures

Faunalytics. Global Animal Slaughter Statistics & Charts. Used for global figures on land animals and trends.

Our World in Data. How many animals get slaughtered every day? Used for rounded daily figures, including chickens, pigs and cattle.

CBS. Meat production; number of slaughterings and slaughter weight by animal species. Used for Dutch slaughter figures.

Animal Charity Evaluators. The Effects of Diet Choices. Used for the estimate of how many animals a year of plant-based eating can save on average.

Wageningen Social & Economic Research / Wakker Dier. Meat consumption per capita in the Netherlands, 2005–2024. Used for context on meat consumption in the Netherlands.

Mood & Brooke, Cambridge University Press. Estimating global numbers of fishes caught from the wild annually from 2000 to 2019. Used for the estimate of wild-caught fish.

Note: figures on this page have been rounded to keep them easy to understand. There is more uncertainty around fish because they are often measured by weight rather than counted as individual animals.